The Canadian market continues to outperform all major markets, having advanced a little over 7% in the first 6 months of the year versus slight declines for the rest of the developed world (in Canadian Dollars).
The following table summarizes the price performance of the main indices for the second quarter and the first half of 2005.
| Second Quarter | First Half | |||
|---|---|---|---|---|
| In local currency | In Canadian Dollars | In local currency | In Canadian Dollars | |
| S&P/TSX (Cdn) | +3.02% | +3.02% | +7.10% | +7.10% |
| S&P 500 (US) | +0.91% | +2.14% | -1.70% | +0.20% |
| Nasdaq (US) | +2.89% | +4.14% | -5.45% | -3.62% |
| Europe (EUR) | +4.05% | -1.63% | +8.53% | -1.17% |
| Nikkei (Japan) | +0.73% | -2.93% | +0.83% | -4.91% |
The main contributor to the Canadian market rally was the commodities sector. At the risk of being perceived as bearish on Canada, we would like to caution investors that the energy and materials sectors now account for 39% of the TSX index while financials account for 32%. Moreover, if we were to include oil and gas income trusts in the index, the energy sector alone would account for 26 – 27% of the TSX index, similar to what we witnessed during the last oil shock of the 1970s. Therefore, we find that these 2 sectors do not offer a compelling risk/reward ratio for the time being.
The Canadian Dollar is basically unchanged for the quarter and so is our opinion regarding its long-term value, i.e. at par with the US Dollar by the end of the decade.
We continue to prefer the US Dollar to the Euro. The “Old Europe”, dominated by France and Germany, prioritize social order rather than economic growth. Whereby the “New Europe”, with its capitalist members, demand more economic freedom, less regulation and the implementation of pro-growth tax regimes (i.e. flat tax). Their differences will become more and more problematic going forward. If we were to bet, we would rather choose Ireland, Poland and Czech Republic over France, Belgium and Germany.
Summer is already upon us with its wonderfully hot weather. We understand that reading our quarterly comments might not be your priority when the temperature is so conducive to being outdoors. That being said, we will try not to write too much and use more graphics to outline our investment philosophy just the same. Besides…“a picture is worth a thousand words”…
|
We often hear that “IT PAYS TO BE CONTRARIAN”, (i.e. doing the opposite of the consensus) The questions to ask are: HOW do we define “BEING CONTRARIAN”? WHAT HINTS do we use to decide IT IS TIME TO “BE CONTRARIAN”? |
|
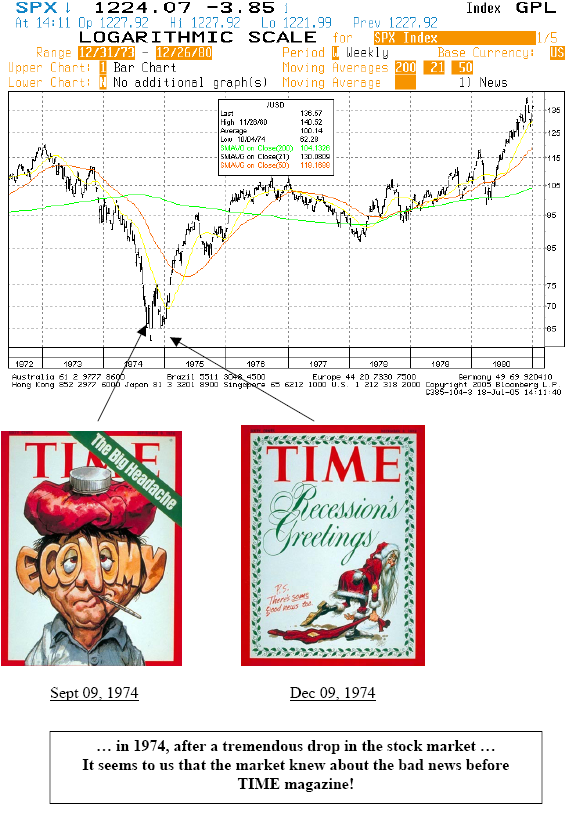
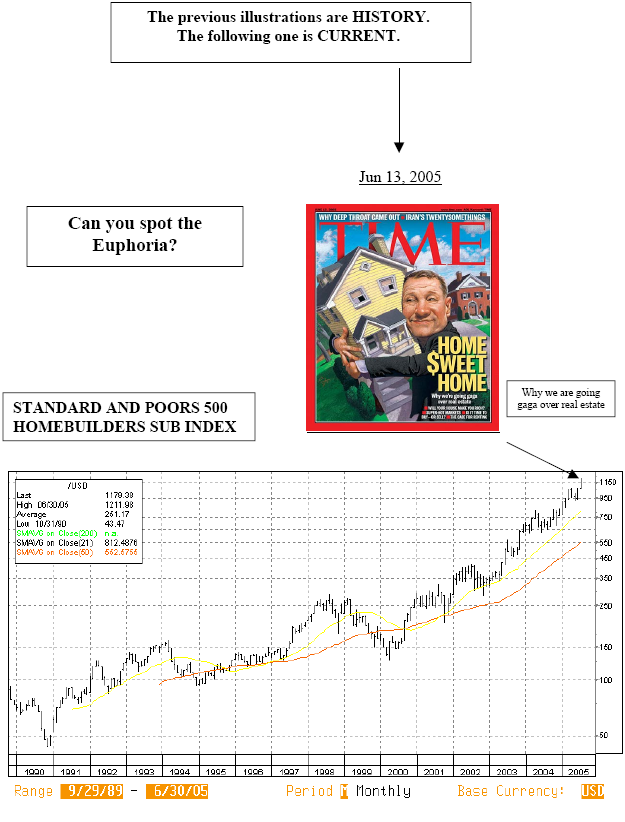
One of the best indicators we have learned over the years is COVER PAGES of popular, best-selling publications. See for yourself … |
|
STANDARD AND POORS COMPOSITE INDEX (US stock market) |
|
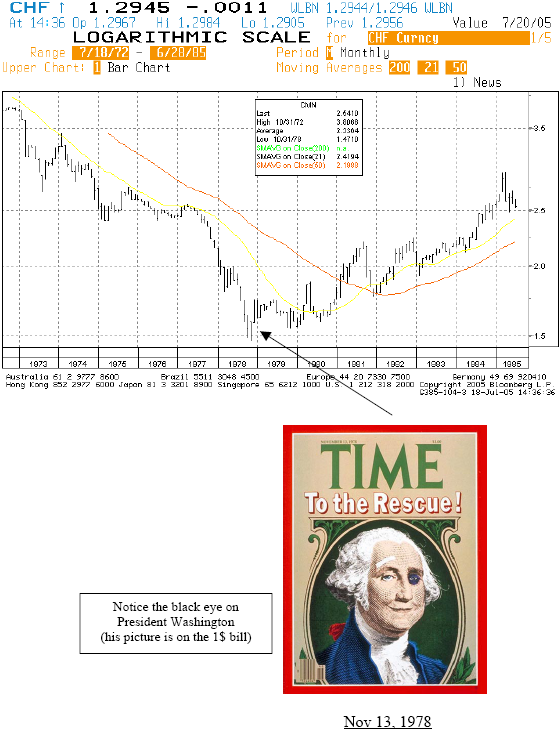
The US DOLLAR VERSUS SWISS FRANC (as a proxy for European currencies) |
|
… 1978, after an endless decline of the US Dollar following Nixon’s decision to put a stop on the convertibility of the USD to Gold. A little late to be bearish on the Dollar! |
|
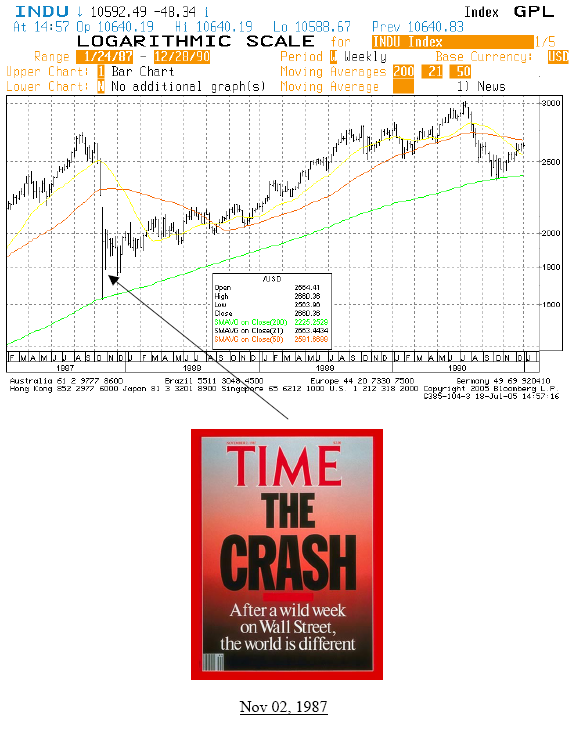
DOW JONES INDUSTRIALS COMPOSITE (The US stock market) |
|
…“After a wild week on Wall Street, the world is different”… Or is it? |
|
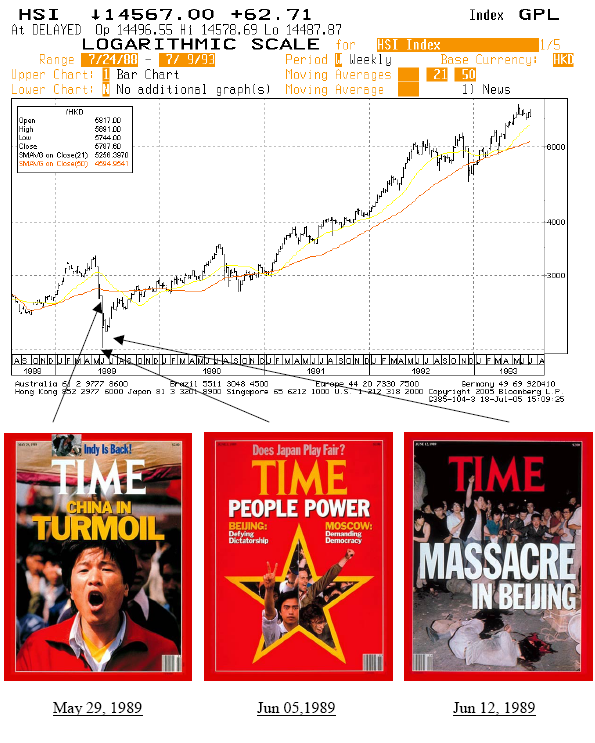
HONG KONG HANG SENG STOCK MARKET INDEX |
|
…There is blood on the street…It is time to BUY… A little cynical, we’ll admit, but true nevertheless. |
|
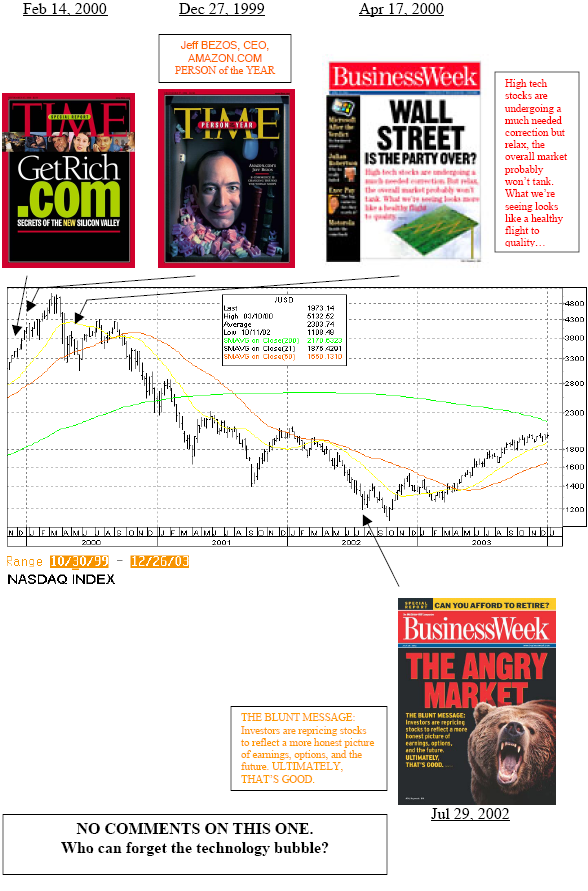
NASDAQ STOCK MARKET INDEX (representing mainly high tech companies) |
|
THE ABOVE PRESENTATION IS FOR ENTERTAINMENT PURPOSES ONLY |
|
PAST PERFORMANCE IS NOT INDICATIVE OF FUTURE RESULTS |
|
HAVE A GREAT SUMMER! |
The Claret Team
P.S. Enclosed please find your magnetized “Claret sans goutte” to use as you enjoy a glass of wine this summer.