2009 has been a good year for most investors, except for those who panicked and sold out of the markets in March and took refuge in the perceived safety of government bonds.
As Benjamin Graham wrote almost 80 years ago in “The Intelligent Investor”, the stock market is a voting machine in the short term but a weighing machine in the long term. Indeed, the long term is as bright as ever for those who believe in the selfcorrecting nature of free markets.
Instead of giving a forecast for 2010, which you can hear on any business television channel or read in any business magazine, we’d rather remind you of certain disciplines that have worked in the past and, we believe, will continue to work in the future.
Having a long term perspective helps you keep your eyes on the horizon, especially when markets get stormy and give you sickness motion…
Below is an updated version of a chart shown in our year-end 2008 quarterly letter. It is the long term price performance of the S&P 500 since 1968 (40 year-period).
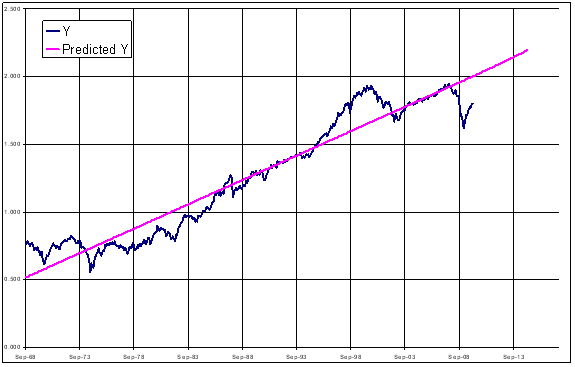
As you can see, the big gap between the pink trend line and the blue market line is narrowing. Over the next few years (maybe 5 to 10 years), it is our guess that the market will fluctuate below its trend line for a fairly long period but that does not mean that the market is not going up.
We have also gone back further in time and done the same analysis since 1927. Below is the chart on a much longer period of time (82 years).
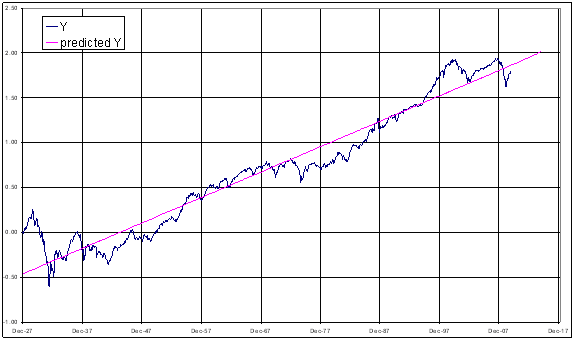
Two things to notice:
· 1929 is a much more serious debacle: 27 months after the bull market high of September 1929, the stock market had lost 75% of its value and was heading lower (it eventually bottomed in June 1932, after shedding a total of more than 86% of its value. A similar story holds for consumer prices: the CPI (consumer price index) declined by 13% in the same 27-month period and fell another 20% before the Depression ended.
· In contrast, as you can see on the chart, 2007 – 2009 decline is fairly mild versus 1929. As we enter 2010, the S&P 500 is 27% off the peak of 2007 and the CPI is 3% higher than 2 years ago.
We know now that the Great Depression of 1929 was triggered by a financial crisis and a loss of confidence in the banking system (by the way, these are almost always the main 2 reasons for a crisis), exacerbated by the wrong Fed policies of not being the lender of last resort. The Federal Reserve failed to do so back then and the banks subsequently collapsed, along with the world economy.
Fortunately, central banks did learn that lesson and stepped in this time as lenders of last resort. That is why you were not lining up in front of the banks, asking for your savings back (remember that image of long lineups in the 30s that they show in movies?).
If we were to make a forecast for the next 5 to 10 years, we would put it this way:
· Based on the 1st chart, if the stock market were to reach its trend line, the S&P 500 would be at 2760;
· Based on the second chart, if the market were to reach its trend line, the S&P 500 would be at 1815.
This will give annualized returns ranging from the most pessimistic 5% to the most euphoric 20%. Adding on dividends of 2.5%, we will get a range of 7.5% to 22.5%. Pick your number… and remember that whatever you pick, the market will not deliver those results in a straight line. Notice that, while the market can stay below the trend line as long as 15 years (1939 to 1954 and 1973 to 1987), the cumulative returns on those years were still decent.
Asset allocation, portfolio diversification and rebalancing are all tools investors should use to stay within their comfort zone…
Investors are always very interested in the performance of their portfolio. After all, returns are all it’s about, or are they?
Below is a graph that tracks 5 hypothetical portfolios of CAD$ 100,000.00 with different equity allocation over a period of 18 years: 100%, 80%, 60%, 40% and 0% Equity (i.e. only invested in government bonds and reinvested every 3 years).
You will notice that:
· The best performing portfolio is the one with 100% Equity, with a Compounded Annual Growth Rate (CAGR) of 8.43%. In dollar amount, it grew from $100,000 to $430,000. In descending order, the portfolios rank as follows:
| Equity exposure | CAGR | in CAD$ term | |
| 1. | 100% | 8.43% | from 100,000 to 430,000 |
| 2. | 80% | 8.09% | from 100,000 to 406,000 |
| 3. | 60% | 7.68% | from 100,000 to 379,000 |
| 4. | 40% | 7.20% | from 100,000 to 350,000 |
| 5. | 0% | 6.02% | from 100,000 to 287,000 |
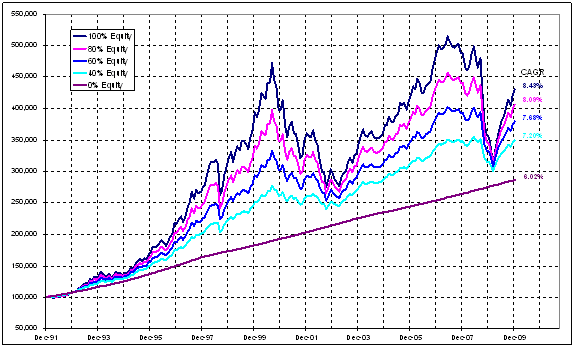
- The peaks and valleys on the 100% Equity portfolio are quite steep, i.e. gains during the good times are spectacular while declines during the bad times are extremely acute;
- As you decrease the equity exposure, the subsequent return also decreases but the peaks and valleys become a lot shallower.
This simplistic observation tells you that, although equities are the best performers in the long run, it also assumes that investors stay the course through gut-wrenching plunges and eye-popping recoveries, something that is not easy for most people.
Every investor has a specific emotional makeup and that should be taken into account, along with all other circumstances (income requirements, anticipated major withdrawal within a specific time period etc…) when choosing their asset allocation. If one invests too heavily in equities and cannot take the heat, one might sustain losses and have a hard time making them up. On the other hand, if one invests too heavily in bonds and CDs, the assets might not keep up with inflation.
We always suggest to our clients an asset allocation that we believe reflects more or less our perception of their emotional makeup. Subsequently, as we get to know them better, fine-tuning may be necessary.
One of the worst mistakes when investing is being convinced that this time is different. As all the graphs above show you, the long term bias of the stock market is upward and that is not a coincidence. If you believe in the self correcting nature of capitalism, democracy and rule of law, combined with human ingenuity, economic growth is natural and therefore so is stock market growth. As investors, we should try our best to figure out how much pain we can take in the case of gut wrenching plunges (the self correcting part of capitalism) so that we do not get to the point where “we cannot take it anymore”. That is precisely when we make the wrong decisions.
Market timing is overrated and disciplined investment process is underrated but that is not what Wall Street and Bay Street would have you believe…
From experience in the markets and studies of human behavior, we can tell you this much:
- Psychologically, it is tremendously difficult to get back in after you get out.
- In time of euphoria reinforced by the media and cocktail party chats, it is difficult to sell out, stay in cash and wait for a correction to get back in.
- While it is difficult to get out of the market at the top, it is even tougher to know when to get back in at the end of a correction or bear market.
- As investors read the newspaper and watch CNBC, it is very difficult for most of them to distinguish between what is noise and what is relevant information. With the proliferation of the Internet, it is getting even more difficult since there are many writers whose agenda is to get them excited and more importantly, get them to trade -, i.e. generate commissions for Wall Street and Bay Street.
Human beings have the emotional disposition to swing from being euphoric and greedy to depressed and panicky as they watch markets go up and down. Unfortunately, these animal spirits make them buy and sell, mostly at the wrong time.
However, if investors spend more time making sure that their asset allocation reflects their objectives after taking into account their emotional constitution, they will be less likely to panic and do the wrong thing at the wrong time.
On behalf of all of us at Claret, we wish you Happy New Year and welcome your comments.
Claret team
P.S.: As the saying goes, if you want to forecast, forecast often…we thought we would end this letter with yet another one: we don’t think 2010 will be as spectacular as 2009 but should be a positive one.