First of all, we would like to wish all of you a Happy New Year for 2009. In order of importance, we would like to wish you good health, happiness and of course, prosperity.
In view of the disastrous performance of global financial markets in 2008, you probably wonder whether our last wish is purely wishful thinking. We are not going to repeat the bad news you read and hear through the media, since we can neither make it more sensational nor more attention-catching than they are. We believe a lot of what is being reported is downright misleading. Instead, we will try to offer different perspectives in order to give you a more rational view of the economy, stock markets and potential returns you can achieve over the next 5 to 10 years.
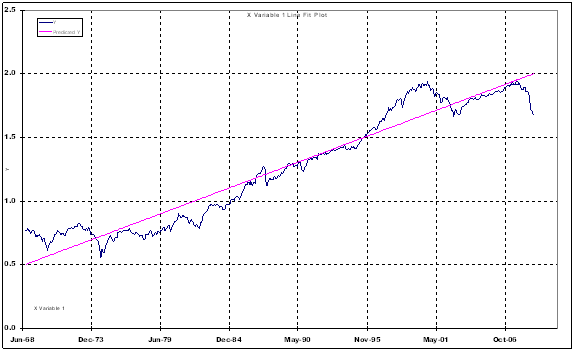
Below is an updated version of a chart (shown in our last quarter-end report) of the longterm price performance of the S&P 500 since 1968, a 40 year-period, which, coincidentally, is also the peak preceding the most severe recession since 1929. The trend line shown represents the average annual growth rate of the price index and is roughly 8.5% per annum (for those of you who love statistics, it is a regression line with a slope of 8.5%).
In the last quarterly letter, we wrote:
· You may have noticed that the market fluctuates around the pink trend line which is its long term growth line. Thus, it would not be outrageous to assume that eventually the market will move back up to the trend line.
As of today, with the S&P 500 at around 833, the index would have to move back to around 1765. It would not make sense to assume that this will happen overnight. However, we did an analysis of the potential return for an investor who starts to invest today (which is all of us since we cannot go back in time) over the next 10 years (even if it takes that long for the economy to normalize). The annualized compounded return would be:
Price return Annualized return Dividend Total return (annualized)
If it takes (A) (B) (A+B)
2 years 111.18% 45% 3% 48%
3 years 111.18% 28% 3% 31%
4 years 111.18% 21% 3% 24%
5 years 111.18% 16% 3% 19%
6 years 111.18% 13% 3% 16%
7 years 111.18% 11% 3% 14%
8 years 111.18% 10% 3% 13%
9 years 111.18% 9% 3% 12%
10 years 111.18% 8% 3% 11%
For example, if it takes 5 years for the market to reach the long term growth line, an investor would have achieved a compounded annual rate of return of 19% including dividends.
If we were to compare these potential returns to government bonds, which are currently yielding between 1% and 4% over the next 10 years, we think that the risk/reward ratio overwhelmingly favors the stock market.
Of course, the sixty four million dollar question is what if this is 1929? So, we went back and tested a dollar cost averaging strategy over that extreme period:
Starting in 1930, which was after a 45% decline of the stock market, an investor starts a strategy which consists of investing $1,000 a month into the S&P 500 index over the next 5, 10 and 20 years. What would have been his return, considering the fact that the stock market did not recover to its 1929 peak before 1954 (it took the market 25 years to recover)
The above “dollar cost averaging” strategy (investing a fixed amount of dollars every month), as simple as it is to execute, would have yielded the investor an annualized return of 13% over 5 years (1930 – 1935), 5% over 10 years (1930 -1940) and 8% over 20 years (1930 -1950). If you stop and think about it, that’s a pretty amazing performance given a worldwide depression (25% of the American work force was unemployed in 1932) and a world war.
Our thinking is that if we are in a similar situation as in 1929, the stock market return would still be decent over the long term versus bonds. Meanwhile, if this is not 1929, we should expect returns to be a lot higher if investors have the discipline to remain invested.
Although the newspapers would have you believe that this could be 1929, most economists have pointed out that there are tremendous differences between now and then, most notably: there was no deposit insurance at financial institutions, no government social safety nets, no coherent monetary and fiscal policies and above all, no global coordination to solve these economic problems.
The attitude of many investors today is to wait and see what happens. This attitude is quite understandable since markets are volatile, the media bombards us with more and more bad news on the economy, Wall Street provides us with scandal after scandal and industry after industry is demanding bail-out packages from the government.
Most investors have the feeling that they have been duped by Wall Street and that the capitalist system is broken. Politicians demand more laws and regulations in the name of protecting the taxpayer.
While we agree that capitalism run amok is a bad idea, we also strongly believe it is the best system to help us recover over time. Politicians always take advantage of unstable situations to try to impose more regulation and more legal framework under the assumption that they are the ones to protect the taxpayer. Yet, they are also the ones who succumbed to the lobbyists and approved all the lax regulations surrounding the subprime mortgage mess, starting with the Clinton administration in 1998. They also relaxed the reporting rules to allow the hedge fund industry to speculate wildly without oversight. Politicians also approved legislation to allow investment bankers to leverage their balance sheet to a ratio of 30 to 1.
We can go on and on about how we have all contributed to the current mess. As the saying goes; “It takes two to tango” (bad bankers need help from the politicians to take advantage of the system and crooks need greedy investors to pull off fraudulent schemes). In a nutshell, many are involved, from the ambitious banker to the corrupt politician to the greedy investor. In spite of it all, the answer is not more regulation but better regulation and of course, its proper enforcement. We need a regulatory system that takes into account both the benefits and drawbacks of the greedy and self serving aspects of human beings, including those of politicians and policy makers.
In the meantime, as the system heals itself (and it always does), financial markets will improve and by the time the good news hits the newspapers that the economy is back on its growth trajectory, we will find the stock market significantly higher than it is now. It reminds us of something Warren Buffett wrote in one of his annual letters:
When he was analyzing the financial statements of Washington Post (WPO) back in the 70s, he calculated that it was worth somewhere between $50 – $70 a share. Yet, the stock was trading in the mid teens. Just to be thorough, he called most of the analysts on Wall Street to get an idea of what WPO was worth according to “the experts”. He was surprised that while most of the analysts thought his calculation was right on, they were not recommending the stock because they thought it might go down further before it goes up.
It is no wonder that historically, the most popular investment strategy at the end of a bull market is to “buy and hold” for the long term whereas at the end of a bear market, the most popular strategy is “market timing”.
Many doomsayers forecast the decline of American dominance in the world. Some even say that America is no longer a good place to invest. While the first part of this forecast could be somewhat true (although it might not happen in our lifetime), the second part should be put into context.
The world economy is changing. From centuries ago to date, economic power has shifted several times. Economically speaking, Europe dominated the world from the 19th century to World War I. Then, economic power started shifting to the US. It would not be surprising to see this shift continuing towards Asia.
Meanwhile, we should hope that the developing world grows faster than the US because it would not be conceivable for the US to pull everybody in Asia out of poverty by buying whatever the Asians can export. After all, Asia, with the size of their population, should be able to develop a thriving domestic market to support their own production of goods. As it grows, it will become a bigger part of the global economic pie. Consequently, the US will end up being a smaller contributor to global economic growth, meaning that, instead of being 25% of the world economy today, it will be 20% of a much bigger world economy 20 years from now. Not only is there nothing wrong with this potential picture, it is actually something we should hope for because richer countries have less tendency to foster animosity, which then leads to social unrest.
In term of investment returns, European stock markets have grown at around 8% annually (including dividends) during this 100 year long economic shift, slightly lower than the long term growth rate of the US markets but still a reasonable return. Moreover, if we look at the growth rate over the last 40 years, it is actually similar to the US.
In other words, as Asia becomes more prominent, so will corporate America as about 45% – 50% of revenues from the S&P 500 list of companies are derived outside the US. Therefore, US stock markets may perform as well as Asian markets but without the latter’s structural flaws.
In conclusion, investment is about optimism, believing in human ingenuity, innovation and despite all the violent undulations of the economic cycle, the inherent belief that the future will be better than the past. That is the big assumption behind a capitalist society. We strongly believe in it and sincerely hope you do as well.
CLARET