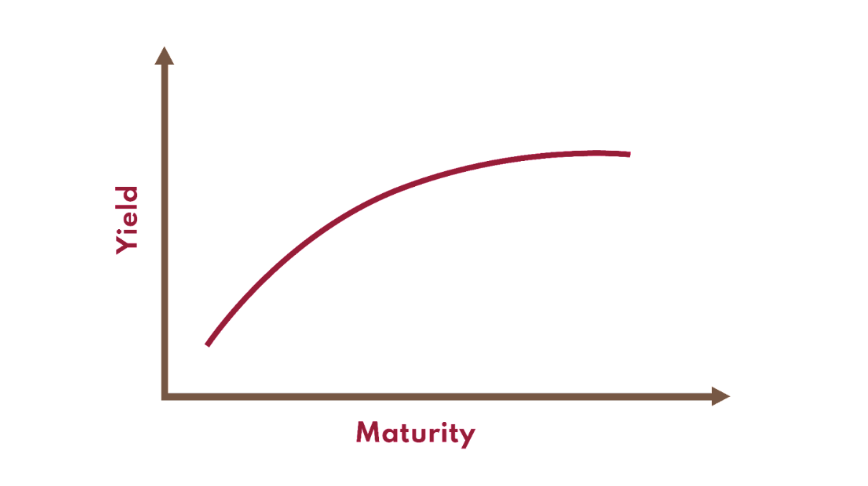
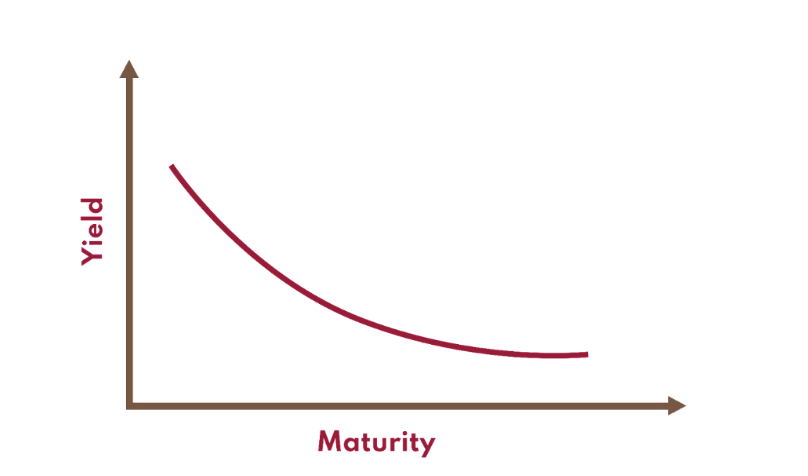
In finance, one of the most scrutinized indicators is the yield curve. Under normal circumstances, the yield curve shows longer maturities carrying higher interest rates than nearer-term ones. When it becomes inverted, ie., when short-term bonds offer higher yields than long-term ones when economists begin to pay close attention.
As the possibility of a recession in 2024 continues to swirl, the question remains: are Canadian government bonds a haven or a risk for investors? And is today’s inverted yield curve as useful for predicting a recession as we think?
What is a yield curve?
The yield curve is presented in graphical form and shows how much different types of loans earn, depending on their duration. In Canada, we mainly use government bonds as a benchmark. Normally, the shape of this graph is ascending, meaning that bonds of longer duration offer a higher rate of return than bonds of shorter duration.

Logically, if you lend money to someone for a short period, like a few months, the risk of them losing their job and being unable to repay you is lower — so you’ll accept a lower interest rate. On the other hand, a lot can happen if you lend money over a longer period, like five years. To accept this risk, you’ll ask for a higher rate.
Once bonds have been issued by the government, they go to market and trade according to supply and demand. Sometimes, this relationship between duration and yield can be reversed. This was the case in 2022 and 2023 when one-year GICs paid a higher yield than those with longer maturities. Strange, isn’t it? The longer you keep your money in the bank, the less money you make.

Why does the yield curve invert?
There are mainly two reasons why the yield curve inverts. One is that trading in the government bond market serves as a kind of early warning system, identifying dangers that individual forecasters might not spot. The second is that shifts in the shape of the yield curve play a role in triggering downturns, by undermining confidence in the economy. If people believe the economy is going to do badly, they prefer to buy longer-term bonds, pushing rates down. Generally speaking, the more people want something – in this case, long-term bonds – the more they are willing to pay. When the price of a bond goes up, its yield goes down, which means you receive the same income but you paid more on a larger investment.
Central banks also have an impact on the shape of the curve. When they adjust key rates, this has a direct effect on short-term rates. A rapid rise in rates can result in higher short-term rates than long-term rates, inverting the curve. This strategy is used to counter inflation or cool down an overheating economy.
Is a yield curve inversion an indicator of recession?
The US yield curve has been inverted since July 2022. If we go back to 1978, the data show that it takes between 6 and 18 months for the economy to enter recession following an inversion of the yield curve.
Economists have been predicting a downturn for months; yet a recession seems nowhere in sight (yet). The labour market is strong, the stock market is thriving, and inflation is cooling compared to last year. So, where is the recession?
Skeptics point to three things that are different about the current cycle. First, the gap between shorter-term yields and longer-term yields is smaller than its historical average, so it would take fewer expected rate cuts to revert the curve back to a normal curve; second, there is a path to the easing of inflation, with expected gradual cuts to be made in the next two to three years. Third, if forecasters are pessimistic now, expectations priced into the yield curve are probably also overly pessimistic, so the argument that the inverted curve validates the consensus forecast of a recession is circular, to say the least. (Which came first? The chicken or the egg?)
Nevertheless, it should be noted that, of the last 10 recessions, eight were preceded by an inversion of the yield curve. Only time will tell whether we’ve managed to dodge a recession or one is about to start.


