In the wake of the recent news about the coronavirus epidemic, stock markets around the world have experienced drops ranging anywhere from 10% to 20%.
Historically, the U.S. market averages one 11% drop a year between a peak and its lowest level. Typically, a trigger event is at the origin of such downturns, and the coronavirus is a perfect example! Whether an epidemic, a trade war or any other economic shock, the stock market tends to amplify the real impact of these various incidents.
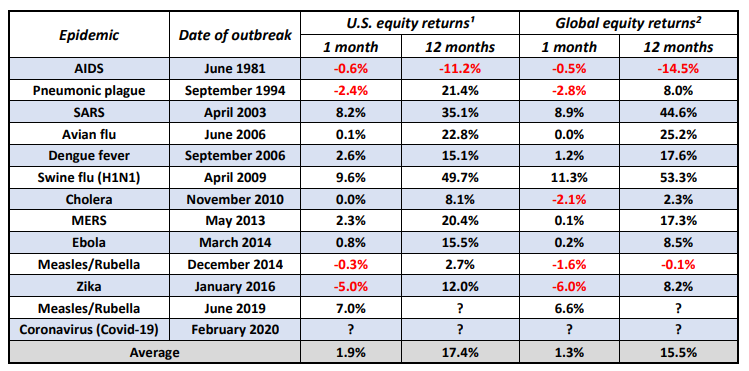
Here are some statistics on historical returns following major epidemics since 1981:

Epidemics can impact the returns of both U.S. and global equities over in the very short term. As for the longer term, you be the judge!
Bear in mind that market turbulence can lead to opportunities, and it’s on these that we must keep our focus.
If you’re interested, here is a link that allows you follow the evolution of the virus live:
https://www.worldometers.info/coronavirus/
As usual, your questions and comments are always welcome.
¹ S&P 500 Index total returns – The 1-month return represents the return during the month of the outbreak and the 12-months return represents the return over the next 12-months including the month of the outbreak
² MSCI World Index total returns – The 1-month return represents the return during the month of the outbreak and the 12-months return represents the return over the next 12-months including the month of the outbreak


