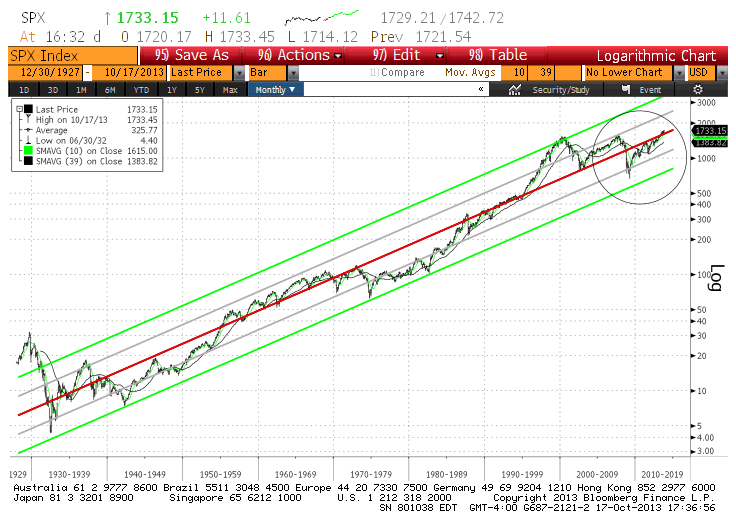
First things first: let’s take a long-term view of the stock market represented by the S&P 500 in this case. (We could have shown you other indices but the results are similar.) We published this chart back in 2008 as our roadmap for the future. The red line is a regression line since 1927. Simplistically, we can say that it represents the long-term trend of the market. Whenever the market is above the red line, we can qualify that it is overvalued. On the other hand, when it is below the red line, the market is undervalued.

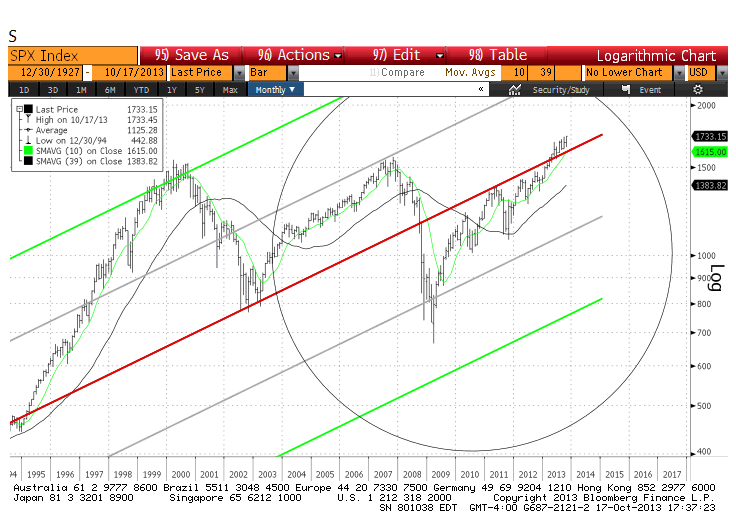
Now let’s enlarge the circled part of the previous chart:

As we can see – in hindsight — the stock market was very much undervalued back in 2009. This is no longer the case today since we are slightly above the red line. Please note that it does not mean that the market is currently expensive or there’s a crash coming. It just means that finding bargains are becoming more difficult and corrections could become more frequent.
A lot of questions have been asked regarding the US government shutdown, its debt ceiling and risk of default. Obviously, we can only hope that politicians on both side of the aisle are not foolish enough to take this fight to the point of no return. As to the impact on financial markets, we are a little indifferent since this is the 18th shutdown since the mid-1970s and they have been mostly non-events. As of this writing, it is yet again another non-event for now from the financial markets perspective and the battle between both political parties has been rescheduled to January 2014. Stay tuned….
To correct or not to correct?
Stock markets in developed countries have had a wonderful run since the financial crisis of 2008-2009. Obviously, the question in most investors’ minds relates to the next meaningful correction: when and how much? Here are two questions you should ask yourself before answering:
- If you have cash lying around waiting to be invested, wouldn’t you hope for a meaningful correction so you could deploy it at a cheaper level?
- If you own companies that continue buying back their shares as a way to return capital to you, wouldn’t you hope for a correction so that they can buy them back at cheaper levels?
As you can see, it all depends on how you look at the situation…. Besides, there is always something to do. There will always be bargains to be found if enough time is spent analyzing in areas where others do not. This reminds me of a quote from Bertha Calloway: “we cannot direct the wind, but we can adjust the sails”.
Fun Facts
Given the general pessimism over the last 6 years – since the financial crisis – we thought it would be a good idea to have some perspective regarding the global economic situation. So here is what has changed since 2007, the year the S&P500 peaked:
- The US population has grown by 4%, or 13 million people;
- The global population has grown by 7%, or 469 million people;
- An average item that cost $100 in 2007 costs $112 today;
- The S&P 500 is up 10% in price level. Including reinvested dividends, it is up over 25%;
- US nominal GDP has risen by 16%, or approximately 2.2 trillion dollars;
- Global GDP has increased by 28% ending in 2012 (most recent data), or 16 trillion dollars. That is nearly the size of the US GDP. In other words, in 5 years, the world has grown by the size of the US economy;
- Tapping into this global growth, the revenue and operating income of non-financial SP500 constituents have grown by 23-24%.
Please note that the last 6 years have exhibited the slowest GDP growth for the US since 1936. The moral of the story: despite all the idiocies that government officials and politicians can come up with, Adam Smith’s invisible hand still works wonders over time (Adam Smith is a Scottish philosopher and economist who is best known for his book on The Wealth of Nations, one of the most influential books ever written). Thank goodness!
The Claret Team


