Canada’s inflation rate has cooled significantly, sitting at 1.9% in June 2025, down from 6.9% in October 2022 and 4% in August 2023. While many Canadians are feeling some relief at the grocery store and gas pump, inflation remains a concern globally. G20 nations like Argentina and Turkey continue to face runaway inflation, while countries like the U.K. and India are still grappling with stubbornly high rates.
So, has Canadian inflation truly peaked — or is this just a lull before another spike? While Canada appears to be in better shape than many of its G20 peers, comparing countries isn’t so simple. That’s because inflation is measured differently across borders, from the composition of the “basket of goods” to how prices are weighted.
Let’s explore how inflation is calculated — and what could be pushing it up or holding it down in 2025.
What is Inflation?
At its core, inflation is simply the rate at which prices for goods and services rise, measuring how much things cost from one year to the next. Another way of looking at it is seeing how far a dollar goes.
How is Inflation Measured?
To measure inflation, economists use something called the Consumer Price Index or CPI. CPI measures the average change over time in prices paid by consumers for a basket of goods and services. CPI is just one of the many ways to measure inflation. Other methods include the Producer Price Index (PPI) and the Personal Consumption Expenditures (PCE) price index.
The CPI basket includes items like food, housing, clothing, transportation, medical care and recreation. The prices of these items are weighted based on their importance to consumers, and then their price increases are measured.
How Does CPI Change Over Time?
In Canada, the basket is determined by Statistics Canada, and it is adjusted every two years to reflect changes to the products and services Canadians buy. For example, in 2019, they removed the purchase of blank CDs and DVDs to add online streaming series. Can you remember the last time you bought a blank CD or DVD?
How is the Owner’s Equivalent Rent (OER) Determined?
A key component of the CPI basket of goods is shelter/housing. In the United States, housing accounts for 33.3% of the CPI’s basket of goods. Included in housing is rent. The way rent is measured is through something called “owners’ equivalent rent,” or OER.
Owners’ equivalent rent (or OER) is the amount of rent that a house owner would have to pay to be indifferent between living in their currently owned house or having it as a rental property. This value is also referred to as “rental equivalent.” In other words, OER figures the amount of monthly rent that would be equivalent to the monthly expenses of owning a property, for example, mortgage, taxes, etc.
Instead of attempting to replicate a household’s actual carrying costs, such as mortgage interest, real estate taxes and insurance, which would vary widely among different households, the Bureau of Labor Statistics surveys owner-occupied households with a relatively simple question: “If someone were to rent your home today, how much do you think it would rent for monthly, unfurnished, and without utilities?”
Cornell University wrote a paper about this titled: “What the Federal Reserve Got Totally Wrong about Inflation and Interest Rate Policy: Getting Real About Rents.”
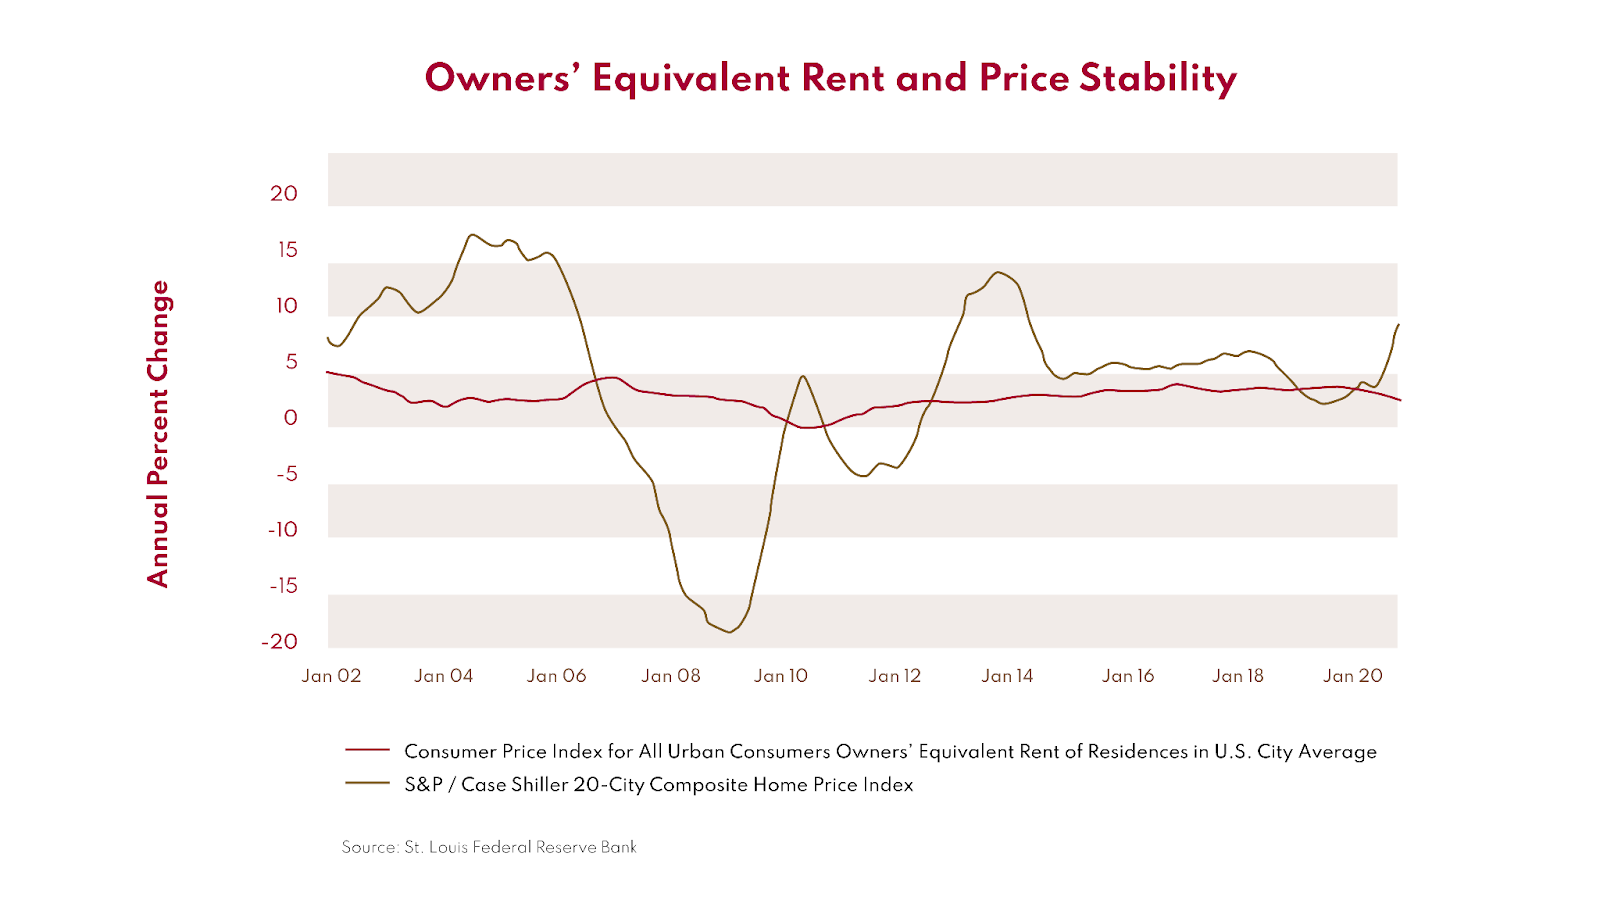
This paper found that when you survey people, they find that their housing price is a lot less volatile than what the market for housing is. As can be seen in the chart below, the reported housing inflation is a lot more stable than what can be measured through the 20-city Case Shiller home price index, which measures data on repeat sales of single-family homes. Another way to look at housing price increases is via the Zillow housing price index.
What Does Today’s Inflation Mean for My Investment Portfolio?
What does today’s inflation mean for your investments? It depends on whether you are trying to predict inflation or invest in strong assets.
At Claret, we are always looking to invest in strong assets. We like to invest in companies that generate stable gross margins that are typically less impacted by inflationary pressures. They can pass along price increases to their customers without seeing a significant drop in demand. In addition, these companies often generate higher profits than their competitors. This makes them an attractive investment for those looking to protect the value of their portfolio over time.