While the stock market usually posts moderate gains during election years, averaging 7% since 1952, 2024 could be an outlier, with the S&P 500 continuing its advance in the third quarter and up 22.08% year-to-date (i.e., to September 30, 2024).
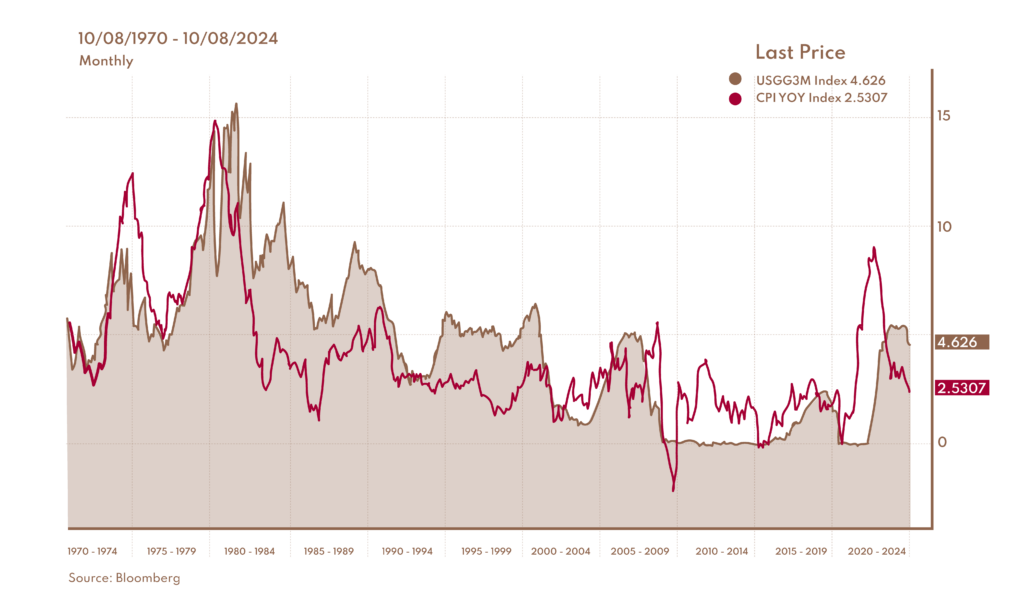
- Interest rates (represented by US 3-month Treasuries Bills), having gone up since Spring 2021 from 0% to a high of 5.0%, have been declining steadily since October 2023 and stand at approximately 4.6%. In the meantime, the US economy seems to be in reasonably good shape, as is the unemployment rate. Usually, interest rates are an indicator of the strength of the economy. As rates are the price of money, the law of supply and demand should apply, meaning that it should go up when the demand for money is strong, as in a strong economy, and it should go down when the demand is weak, as in a slowdown or recession.
If you can indulge us with some technical jargon, we would like to explain our thinking:

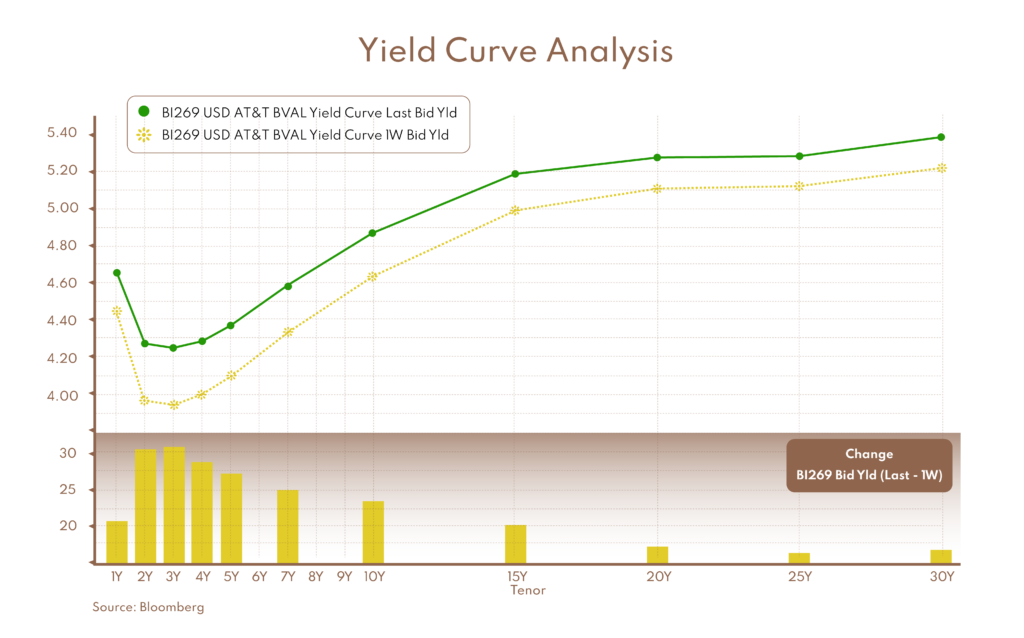
If you registered the different interest rate levels for various maturities of government bonds at a point in time, you would get a set of data. You can graph those data points on a chart with the interest rate level on one axis (the vertical one) and the maturity on the other (the horizontal one). That would give you what economists call a “yield curve.”
On the chart above, the yellow curve reflects interest rate levels from a week ago, and the green line reflects interest rates from this week. Rates are actually moving back up…
Interest rates and inflation
If central banks stop manipulating the interest rate curve (which they have been doing for the last 15 years since the Great Financial Crisis of 2007-2009), we think rates would normalize at a level that should compensate for inflation.

In the chart above, the red line represents inflation since 1970 and the brown line is the 3-month interest rate. As you can see, the brown line usually stays above the red line except for the 1970s—when the inflation rate was double-digit—and from 2010 until Spring 2023. Simplistically, if savers cannot get a return above the inflation rate, why would they save? And without savings, there will be no investments and no growth. We sure hope savers get paid to save…
Back to the yield curve analysis:
- If inflation is around 2-3%, then it is reasonable to think that short-term rates should be around 2.5-3.5%.
- Since longer-term maturity investments are less flexible, investors would demand a higher return, something above 2.5-3.5%. The longer the maturity, the higher the return required to attract savers, which implies additional risk.
- This brings us to a positively sloped yield curve, starting at around 3% and reaching 4.5-5% for longer-term maturities. It is where we are now…
From this perspective, although the short-term rate has room to decline, longer-term rates should not fall much unless economic growth significantly slows down.
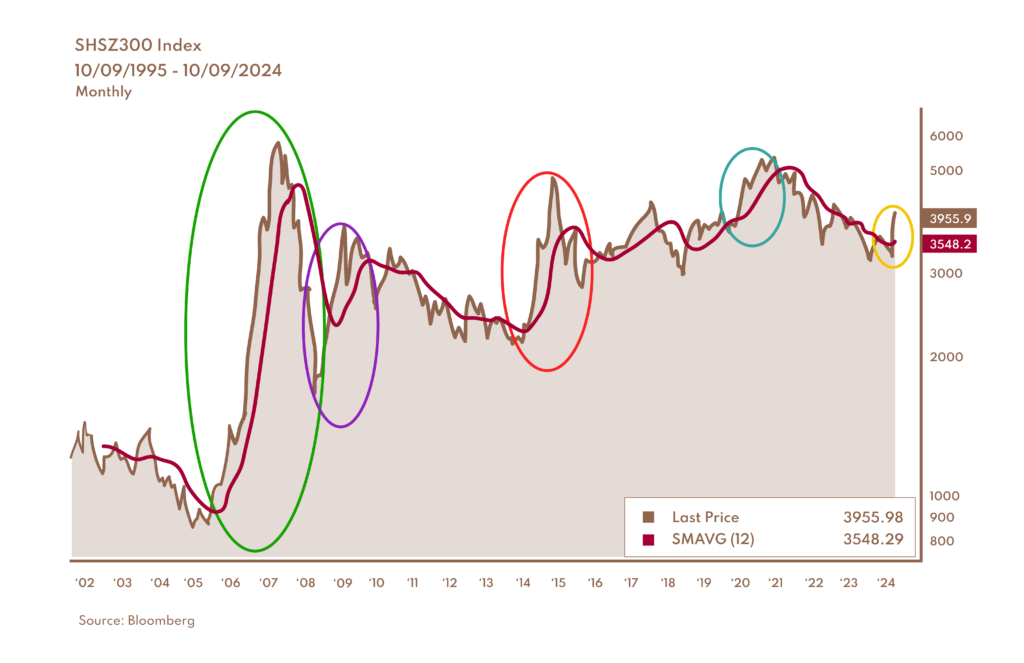
- Late last month, the Chinese government triggered a strong Chinese and Hong Kong stock market rally by announcing aggressive stimulus measures, which included liquidity boosts, interest-rate easing, and support for mortgages. These measures were the most significant since the pandemic and aimed at revitalizing the economy. The CSI 300 index (China equivalent of the S&P 500), which tracks the top 300 stocks on the Shanghai and Shenzhen stock exchanges, surged by over 25% in just a few sessions, as highlighted by the yellow “circle” below.

As you can see in this chart, this is not that unusual in financial markets like China. Governments in these “developing countries,” especially the authoritarian ones, tend to intervene when their financial markets are weak to alleviate the pain of losses for local investors.
Before you chase China as per Wall Street and Bay Street’s recommendations, let’s take a stroll down the Chinese stock market’s memory lane:
- In 2005-2007 (the big green circle in the chart above), China implemented significant market reforms to increase liquidity and investor confidence. A new influx of foreign money dramatically increased participation in the stock market, and speculation ensued. It all ended with the Great Financial Crisis, which saw a nasty correction of over 70% in 2008.
- The government intervened by introducing massive stimulus packages at the end of 2008 (the purple circle). The stock market reacted with a 125%+ increase in 8 months, eventually leading to a correction of 43% in the three years that followed.
- In 2014, not to be discouraged by the volatility it creates every time it intervenes, the Chinese government went at it again by promoting the virtues of stock market investment with loose leverage and margin trading regulations. A massive rally ensued, taking the index up 123+% in twelve months (the red circle), followed by a correction of 40% in the following 8 months.
- Then came the pandemic-induced stimulus measures in 2020-2021 (the blue circle) and now (the yellow circle).
All in all, the Chinese stock market represented by the MSCI China index is still below the level reached 17 years ago, in 2007. In fact, since 1993—a span of over 30 years—including dividends, the total return of the Chinese index is roughly 1.3% annualized…compared to roughly 8-9% for developed markets in North America and Europe.
This is not to say that investing in emerging markets is a bad idea. On the contrary, history has shown that it is quite profitable to do so, but with a very long-term perspective (more than 20 years) and from a shallow base (or after a significant correction). One also needs to be highly disciplined and patient and have a very strong stomach for volatility. Sadly, most investors don’t qualify for this endeavour because they suffer from the principle of “loss aversion.” A key principle in behavioural economics and psychology developed by researchers Daniel Kahneman and Amos Tversky refers to the psychological pain of losing something, which is generally twice as powerful as the pleasure of gaining something of equivalent value. For example, losing $50 tends to feel much worse than the joy of finding $50.
This phenomenon can significantly influence decision-making, often leading people to avoid risks even when potential gains are substantial.
The US election is approaching fast. It will be one of the most polarized political events in American history. As for Canada, we are also approaching the possibility of new elections. As you brace yourselves for the result on both sides of the border, please remember that politics have minimal effect on the stock markets over the long term. As for the short term, we prefer not to pay too much attention to it: it is mostly noise and a very large, distressing distraction.
On the high seas, under windy conditions, it is better to keep your eyes on the horizon to avoid getting seasick.
Have a good fall season.


