Just like the adage on Wall Street that markets always climb a wall of worry, Global Equity Markets – defined by MSCI World Index Total Return – put up a stellar performance by advancing more than 11% in the fourth quarter of 2023, and for the year, worldwide equities moved up 23.8% in US Dollar terms.
Now with a slightly longer-term perspective, 2022 was a pretty bad year when Central Banks realized that they might have printed a little too much money to counter the pandemic-driven recession. Inflation started creeping in, and the increase in prices of goods and services eventually reached above 9% (year-over-year change) in June 2022 (please refer to our Q3 letter for an explanation). In a move to stop the onslaught, they started raising interest rates globally and there you have it, markets reacted negatively, falling an average of 18% in 2022.
For the whole 2-year period of 2022-2023, Global Equity Markets barely moved, advancing on average less than 1.5% annually.
What does 2024 look like?
Going into 2024, it seems that we are somewhere in the middle, a zone of reasonableness. Equity markets are not too high or too low. Earnings multiples are reasonable considering the level of interest rates, and the outlook for the economy is neither convincingly positive or negative.
Let us address some of the worries investors have with a few historical statistical observations:
Too much debt…
With the downgrade of the US debt rating in August last year, many worry Uncle Sam is moving towards insolvency while politicians are quibbling about border control and pork barrel spending. In Canada, with out-of-control federal spending, a presumed mortgage “meltdown” and the G7’s “most indebted households” status, the situation similarly spooked us.
Yes, many debt measures are up, and significantly. However, it does not portend a crisis.
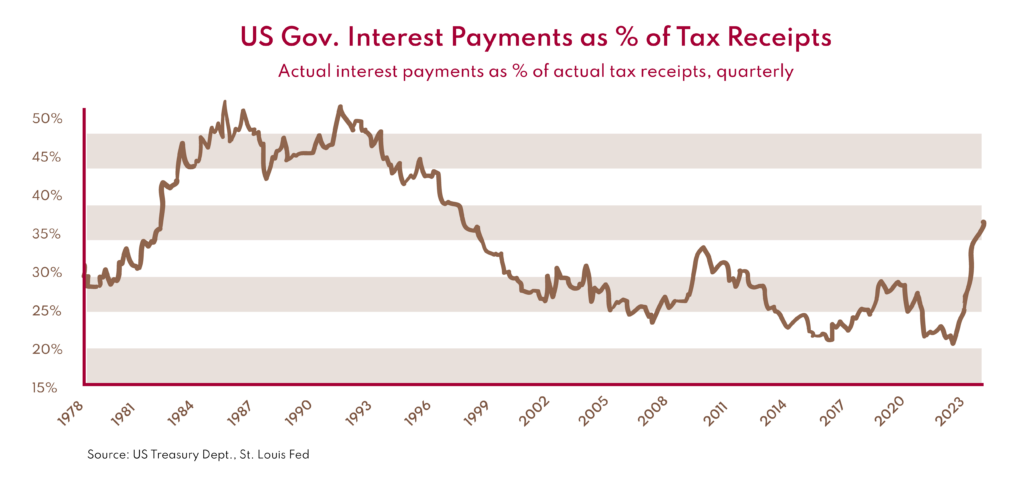
Although most economists use debt to GDP ratio to assess the financial condition of an economy, we think it is misleading. A better measure would be annual tax revenue versus interest payments. Just like we analyze companies, we use cash flow primarily to measure its sustainability.
In 2023, according to the Congressional Budget Office, US interest payments were 14.8% of tax receipts, lower than during most of the booming 1980s and 1990s.
Canada’s 9.3% debt service ratio is below the 11% average during 2009-20′s bull market.
We don’t think these are alarming ratios.
Not enough economic growth…
It is rational to believe that equity markets and the state of the global economy are intertwined. However, the magnitude of market moves isn’t necessarily reliant on robust economic growth. The relationship is more nuanced than many investors appreciate. Take China as an example:
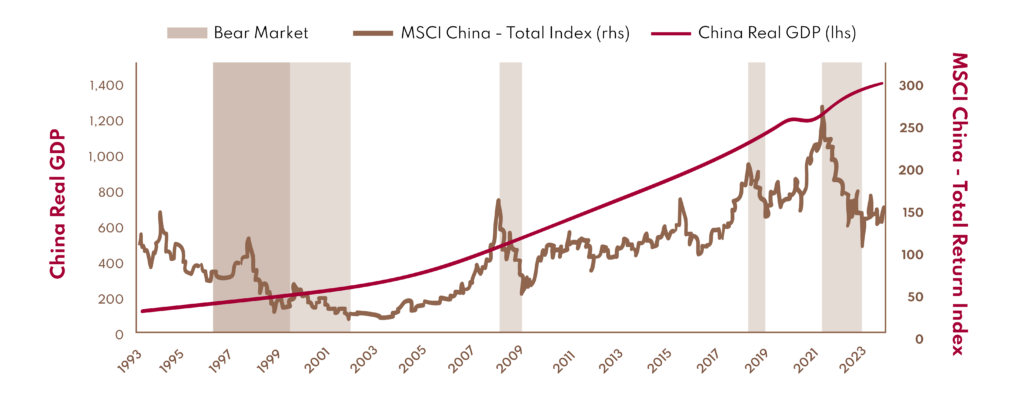
As the graph shows, Chinese GDP Rises While Chinese Equities Trail.
The disconnect between GDP and equity prices is routinely observed. What we notice over time is that while GDP growth is indeed important for equity markets to perform well, the magnitude of economic performance does not seem to matter much. Equities can do just fine in any environment of positive economic growth – regardless of magnitude.
To be perfectly honest, we never really know what is going to happen. A legendary investor once said, essentially, we walk every day into the unknown, and it’s much more profitable to acknowledge that we walk into the unknown than to have a very definite opinion of what’s going to happen and take the chance of being wrong. A quote from Mark Twain has the same sort of tone: “It Ain’t What You Don’t Know That Gets You Into Trouble. It’s What You Know for Sure That Just Ain’t So.”
As we enter 2024 knowing that we don’t know what the future holds, we endeavor to pay attention to each of our individual investments and strategies. That is what we have done since Claret was founded and we believe it is the best way to succeed.
Here are some topics that we find worthy of mentioning regarding investments in general:
Top 10 Biggest Companies in the S&P 500 from 1980 to 2020
We found a very interesting video on YouTube highlighting the top 10 biggest companies in the S&P 500 from 1980 to 2020.
It is noteworthy that it is very difficult for a company to stay in the top 10 consistently over a long period of time. Exxon is the most consistent of all, being in the top 10 from 1980 to 2010. Today, it is 15th in ranking…
The Magnificent Seven
The Magnificent Seven refers to the 7 largest US-based public companies in terms of their market capitalization. They are in alphabetical order Alphabet (think Google), Amazon, Apple, Meta Platforms (think Facebook and Instagram), Microsoft, Nvidia (think computer chips) and Tesla (think Elon Musk).
Together, not only do they represent 30% of the S&P 500 total market capitalization, their combined weight is greater than all the stock publicly traded in Japan, Canada and the U.K. combined, as represented in the MSCI All Country World Index.
In 2023, their stock prices had a banner year, up an average of 115%. However, they were also pummelled in 2022, down on average a whopping 46%. For the 2-year period, they were up on average 8% total.
It is also interesting to note that while all global equity markets combined are worth around 110 Trillion US Dollars and the US equity markets are around 45 Trillion US Dollars, just 2 of the “Magnificent seven” – Apple and Microsoft – are worth 6 trillion US Dollars combined, almost 6% of all publicly traded equities and a whopping 13% of the US markets…. Granted, they are also some of the most profitable businesses in the world.
Some of you may remember, at one point in time (circa 2013), CNBC came up with the acronym called the FANG stocks: Facebook, Amazon, Netflix and Google. Then Apple was added into the group and the acronym became FAANG. In 2015, Google changed its name to Alphabet and in 2021, Facebook changed its name to Meta Platforms. So FAANG lost its “G” and its “F”. Some commentators saw fit to add Microsoft to the group and a new acronym surfaced, MAMAA: Meta, Amazon, Microsoft, Apple and Alphabet. As tech stocks continue to outperform, 2 more names deserve mention: Nvidia and Tesla. Readable acronyms being hard to find with more and more letters, Wall Street settled for the “Magnificent Seven”.
Obviously, this has nothing to do with finance. It is pure marketing.
Credit Markets
As we mentioned in the last quarterly letter, lots of investors don’t know that the global Credit Markets are 3 times the size of the Global Equity Markets – over 300 trillion US Dollars. Most are unfamiliar with what the Credit Market is.
The credit market is a financial market where companies and governments issue debt securities to investors, such as investment-grade bonds, junk bonds, and short-term commercial paper. The credit market is also known as the debt market.
Investors and institutions can buy debt securities such as bonds in the credit market. Issuing debt securities is how governments and corporations raise capital, taking investors’ money while paying interest until they pay back the debt principal at maturity.
The credit market is a significant source of financing for companies and governments worldwide. It is worth noting that the state of the credit market acts as an indicator of the relative health of the markets and the economy as a whole. Some analysts refer to the credit market as the canary in the coal mine because it typically shows signs of distress before the equity market.
The factor having the greatest effect on the credit/debt market is the level of interest rates. Since the latter had stayed unusually low for more than a decade (from the Great Financial Crisis (2008-2009) to the end of the Pandemic (2021-2022)), most investors and institutions have lost interest in this market as the reward was not sufficient for the risk taken – remembering that bonds fall in price when the cost of debt (the interest rate) rises.
Things have changed since the reappearance of inflation in mid-2021. Rates have moved decisively higher and returns on high-yield corporate bonds have reached the 8.5-9% level, providing a very decent return relative to the equity market, with less risk.
Although equity investment remains an attractive alternative, we do believe that over the next 5 to 10 years, a more balanced asset allocation should be considered.
Happy New Year to you all in 2024. May you all enjoy friends, family and happiness, and may we all enjoy less tumultuous and fractious politics as the year unfolds.
Once again, we would like to thank you all for your continued confidence and support in Claret.
– Alain Chung, CFA, Chairman and CIO, on behalf of the Claret team.


